
SUNCOR ENERGY INC
SUNYSETrading Snapshot
- Day Range
- $67.39 – $69.05
- 52-Week Range
- $37.77 – $72.06
- Volume
- $4.81B
- Avg Volume
- $4.28B
- Shares Outstanding
- 1.18B
- Next Earnings
- Nov 1, 2026
Fundamentals Snapshot
- Annual Revenue
- $48.91B
- Last Q Revenue
- $19.01B
- P/E Ratio
- 12.9
- P/S Ratio
- 2.0x
- EPS (TTM)
- $7.57
- Dividend Yield
- 2.49%
- Dilution (1yr)
- −4.4%
Why Investors Own SU
- ✓High-growth profile — revenue up +45.2% YoY with expanding US Equity exposure.
- ✓Healthy economics — 33% gross margin and 25% free-cash-flow margin.
- ✓New products and segments could unlock additional revenue streams.
Execution delays, intensifying competition, and valuation compression if growth decelerates.
SUNCOR ENERGY INC
SU StockOtter · stockotter.space
About SUNCOR ENERGY INC
Suncor Energy Inc. operates as a fully integrated energy enterprise. Its primary focus involves the development of hydrocarbon resources, particularly within Canada's Athabasca oil sands region. Globally, the company undertakes the exploration, acquisition, development, production, transportation, refining, and marketing of crude oil. Domestically, it distributes petroleum and petrochemical products, predominantly under the Petro-Canada brand. Suncor's operations are divided into several key segments: The Oil Sands division extracts bitumen through both mining and in-situ techniques, converting it into refinery feedstock and diesel, or blending it for direct market sale. The Exploration and Production segment manages offshore assets off Canada's East Coast and in the North Sea, in addition to onshore properties in Libya and Syria. The Refining and Marketing segment processes crude oil and intermediate feedstocks into a variety of petroleum and petrochemical goods, which are then sold to retail, commercial, and industrial customers via its network of distributors. The Corporate and Eliminations segment also oversees the operation of four wind farms situated in Ontario and Western Canada. Beyond these core activities, Suncor is also engaged in the trading and marketing of crude oil, natural gas, various byproducts, refined products, and electricity. Established in 1917, the company was initially known as Suncor Inc. before officially changing its name to Suncor Energy Inc. in April 1997. Its corporate headquarters are located in Calgary, Canada.
Otter Score Breakdown
How it's scoredFive components, each rated 1–5★ and equally weighted (20%), averaged to a 0–100 score:💎 Quality — gross margin🚀 Growth — revenue YoY⚖️ Valuation — P/S ratio⚡ Momentum — 30-day price change💧 Dilution — 1-yr share issuance (buybacks score higher)Analyst Price Target
ⓘLatest News & Updates

Suncor Energy: A Refining Windfall, Falling Debt, And Aggressive Buybacks
Suncor Energy earns a Buy rating for its integrated oil sands and refining model, robust cash flow, and aggressive shareholder returns. SU's downstream refining strength, especially outside the U.S., positions it to bene
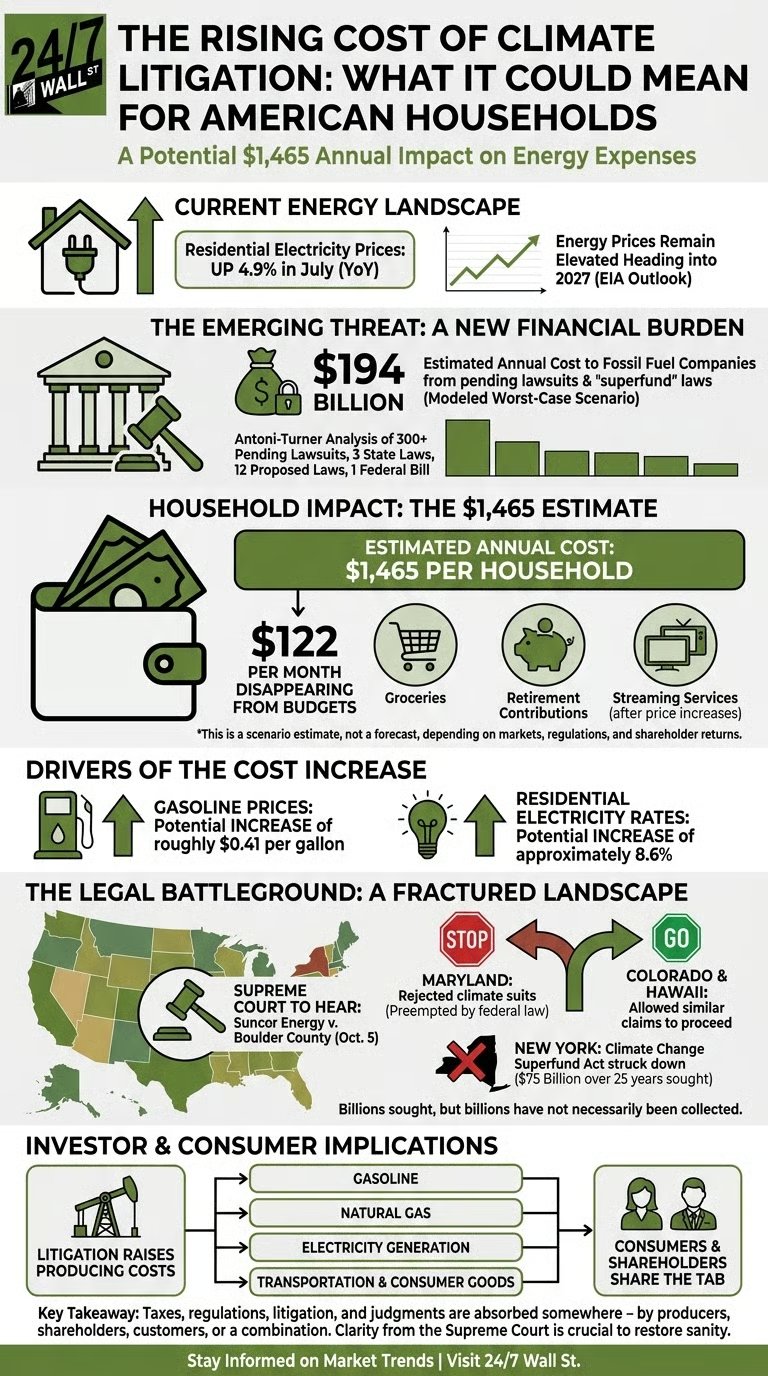
Why Your Energy Bill Is About to Skyrocket $1,465 a Year Higher — Unless This Happens
Climate lawsuits are quietly moving through courts across the country, and a looming Supreme Court case could determine whether energy companies or everyday households foot a bill that one analysis puts in the billions.
Suncor Energy (TSE:SU) Shares Pass Above 200-Day Moving Average – Here’s Why
Suncor Energy Inc. (TSE: SU - Get Free Report) (NYSE: SU)'s stock price passed above its 200-day moving average during trading on Wednesday. The stock has a 200-day moving average of C$88.42 and traded as high as C$96.48
Suncor Energy (NYSE:SU) Hits New 12-Month High – What’s Next?
Suncor Energy Inc. (NYSE: SU - Get Free Report) (TSE: SU) hit a new 52-week high during mid-day trading on Wednesday. The stock traded as high as $72.06 and last traded at $71.8510, with a volume of 4237478 shares changi

Why Suncor Energy (SU) is a Top Value Stock for the Long-Term
Whether you're a value, growth, or momentum investor, finding strong stocks becomes easier with the Zacks Style Scores, a top feature of the Zacks Premium research service.

Should You Buy Suncor Energy Stock After Its 63% Surge in a Year?
SU's 63% gain in 12 months reflects strong cash flow, downstream economics and oil sands gains, but risks could limit further upside.