
STERLING INFRASTRUCTURE INC
STRLNASDAQTrading Snapshot
- Day Range
- $503.06 – $511.91
- 52-Week Range
- $281.58 – $1,005.68
- Volume
- $2.99B
- Avg Volume
- $2.31B
- Shares Outstanding
- 30.7M
- Next Earnings
- Oct 23, 2026
Fundamentals Snapshot
- Annual Revenue
- $2.49B
- Last Q Revenue
- $1.17B
- P/E Ratio
- 36.5
- P/S Ratio
- 4.6x
- EPS (TTM)
- $14.07
- Dividend Yield
- 0.00%
- Dilution (1yr)
- +0.1%
Why Investors Own STRL
- ✓High-growth profile — revenue up +28.6% YoY with expanding US Equity exposure.
- ✓Healthy economics — 59% gross margin and 26% free-cash-flow margin.
- ✓New products and segments could unlock additional revenue streams.
Execution delays, intensifying competition, and valuation compression if growth decelerates.
STERLING INFRASTRUCTURE INC
STRL StockOtter · stockotter.space
About STERLING INFRASTRUCTURE INC
Sterling Infrastructure, Inc. operates across three distinct business segments: transportation, e-infrastructure, and building solutions. The company's operations span a significant portion of the United States, including the Southern, Northeastern, and Mid-Atlantic regions, as well as the Rocky Mountain states, California, and Hawaii. Within its transportation division, Sterling specializes in developing and rehabilitating critical infrastructure. This includes projects such as highways, roads, bridges, airports, ports, and light rail systems, alongside essential water, wastewater, and storm drainage solutions. Their clients in this sector range from state departments of transportation and regional transit authorities to airport, port, and water authorities, as well as railway companies. Furthermore, Sterling delivers specialized site infrastructure development services. These projects cater to high-profile "blue-chip" clients operating within the e-commerce, data center, distribution and warehousing, and energy industries. The building solutions segment focuses on concrete work for both residential and commercial applications. This encompasses foundations for single-family and multi-family residences, as well as parking structures, elevated slabs, and other custom concrete projects. Their client base here includes national, regional, and custom home builders, as well as developers and general contractors in the commercial sector. Originally established in 1955, the company operated as Sterling Construction Company, Inc. until its renaming to Sterling Infrastructure, Inc. in June 2022. Its corporate headquarters are located in The Woodlands, Texas.
Otter Score Breakdown
How it's scoredFive components, each rated 1–5★ and equally weighted (20%), averaged to a 0–100 score:💎 Quality — gross margin🚀 Growth — revenue YoY⚖️ Valuation — P/S ratio⚡ Momentum — 30-day price change💧 Dilution — 1-yr share issuance (buybacks score higher)Analyst Ratings
ⓘLatest News & Updates
Why Sterling Infrastructure (STRL) Dipped More Than Broader Market Today
Sterling Infrastructure (STRL) closed at $498.36 in the latest trading session, marking a -2.72% move from the prior day.
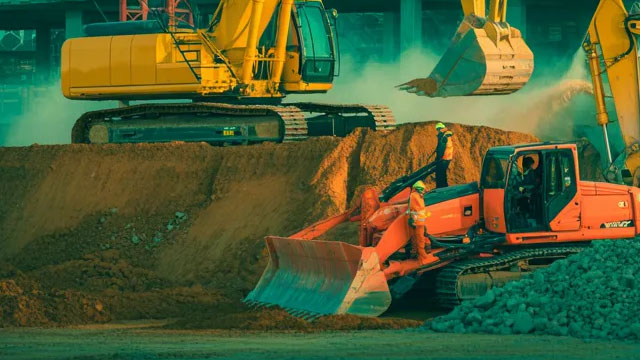
Is Sterling's $130M-$140M CapEx Plan Fuel for Its Next Growth Leg?
STRL's revised capital expenditure plan targets E-Infrastructure growth, expanding capacity and productivity as its backlog and demand surge.

Sterling vs. Quanta: Which Infrastructure Stock Is the Better Buy?
PWR offers broader infrastructure exposure and a $53.4B backlog, while STRL leads on momentum, valuation, ROIC and projected earnings growth.

Undercovered Dozen: Rithm Capital, Sterling Infrastructure, Corning And More
The Undercovered Dozen series spotlights 12 lesser-covered stocks featured on Seeking Alpha. This curated selection aims to provide fresh investment ideas and foster community discussion around under-the-radar equities.
Sterling Infrastructure (STRL) Is Considered a Good Investment by Brokers: Is That True?
When deciding whether to buy, sell, or hold a stock, investors often rely on analyst recommendations. Media reports about rating changes by these brokerage-firm-employed (or sell-side) analysts often influence a stock's
AI's Physical Bottleneck Isn't Chips. It's These Contractors.
AI chips get the attention, but these three contractors sit at the physical bottleneck. See how their backlogs, growth, margins, and risk compare as data center spending accelerates.