
FREEPORT-MCMORAN INC
FCXNYSETrading Snapshot
- Day Range
- $70.06 – $71.41
- 52-Week Range
- $35.15 – $80.24
- Volume
- $1.97B
- Avg Volume
- $2.17B
- Shares Outstanding
- 1.44B
- Next Earnings
- Dec 14, 2026
Fundamentals Snapshot
- Annual Revenue
- $25.74B
- Last Q Revenue
- $7.03B
- P/E Ratio
- 34.8
- P/S Ratio
- 4.0x
- EPS (TTM)
- $2.04
- Dividend Yield
- 0.85%
- Dilution (1yr)
- −0.1%
Why Investors Own FCX
- ✓High-growth profile — revenue up +21.9% YoY with expanding US Equity exposure.
- ✓Healthy economics — 57% gross margin and 9% free-cash-flow margin.
- ✓New products and segments could unlock additional revenue streams.
Execution delays, intensifying competition, and valuation compression if growth decelerates.
FREEPORT-MCMORAN INC
FCX StockOtter · stockotter.space
About FREEPORT-MCMORAN INC
Freeport-McMoRan Inc. is a prominent mining enterprise conducting extensive operations across North America, South America, and Indonesia. The company primarily focuses on the exploration and extraction of key mineral resources such as copper, gold, molybdenum, and silver, alongside other valuable metals. Additionally, it maintains a significant presence in the oil and gas sector. Its diverse portfolio of assets features the notable Grasberg minerals district in Indonesia; numerous sites in the United States including Morenci, Bagdad, Safford, Sierrita, and Miami in Arizona; Tyrone and Chino in New Mexico; and Henderson and Climax in Colorado. In South America, its holdings include Cerro Verde in Peru and El Abra in Chile. Beyond its mineral interests, Freeport-McMoRan operates a collection of oil and gas properties, predominantly situated off the coasts of California and in the Gulf of Mexico, managing approximately 135 wells as of December 31, 2021. Founded in 1987 and headquartered in Phoenix, Arizona, the company adopted its current name, Freeport-McMoRan Inc., in July 2014, having previously operated as Freeport-McMoRan Copper & Gold Inc.
Otter Score Breakdown
How it's scoredFive components, each rated 1–5★ and equally weighted (20%), averaged to a 0–100 score:💎 Quality — gross margin🚀 Growth — revenue YoY⚖️ Valuation — P/S ratio⚡ Momentum — 30-day price change💧 Dilution — 1-yr share issuance (buybacks score higher)Analyst Price Target
ⓘLatest News & Updates
Why Investors Need to Take Advantage of These 2 Basic Materials Stocks Now
Investors looking for ways to find stocks that are set to beat quarterly earnings estimates should check out the Zacks Earnings ESP.
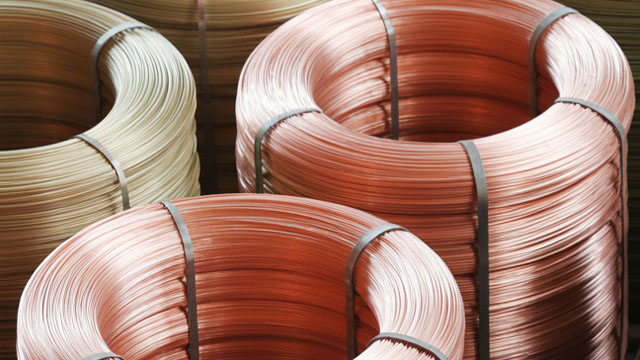
Can Freeport-McMoRan's Growth Projects Drive the Next Expansion Wave?
FCX advances major expansion projects, lifting copper capacity and output as its organic pipeline targets the next growth phase.
NTHM's Index Rebalance Puts Thematic Rotation to Work
The latest rebalance of VettaFi's Thematic Rotation Quality Momentum Screened Index (TQRMS), tracked by the NBI Thematic Rotation ETF (NTHM:TSX), reshapes the portfolio around a new set of themes. GLP-1 weight loss drug

FCX vs. SCCO: Which Copper Mining Giant Should You Bet on?
Freeport and Southern Copper push ahead with major projects leveraging strong cash flows and favorable copper prices.

Freeport-McMoRan (FCX) Registers a Bigger Fall Than the Market: Important Facts to Note
Freeport-McMoRan (FCX) reached $72.58 at the closing of the latest trading day, reflecting a -2.38% change compared to its last close.
Freeport-McMoRan Inc. (FCX) is Attracting Investor Attention: Here is What You Should Know
Freeport-McMoRan (FCX) has received quite a bit of attention from Zacks.com users lately. Therefore, it is wise to be aware of the facts that can impact the stock's prospects.