VERMILION ENERGY INC
VETNYSETrading Snapshot
- Day Range
- $11.26 – $11.50
- 52-Week Range
- $7.10 – $14.82
- Volume
- $2.11B
- Avg Volume
- $2.23B
- Shares Outstanding
- 152.8M
- Next Earnings
- Nov 29, 2026
Fundamentals Snapshot
- Annual Revenue
- $1.76B
- Last Q Revenue
- $519M
- P/E Ratio
- -5.4
- P/S Ratio
- 1.3x
- EPS (TTM)
- $-2.92
- Dividend Yield
- 3.34%
- Dilution (1yr)
- −5.0%
Why Investors Own VET
- ✓High-growth profile — revenue up +59.2% YoY with expanding US Equity exposure.
- ✓Healthy economics — 28% gross margin and 21% free-cash-flow margin.
- ✓New products and segments could unlock additional revenue streams.
Execution delays, intensifying competition, and valuation compression if growth decelerates.
VERMILION ENERGY INC
VET StockOtter · stockotter.space
About VERMILION ENERGY INC
Vermilion Energy Inc., an international energy firm operating through its subsidiaries, focuses on the full lifecycle of oil and natural gas, encompassing their acquisition, exploration, development, and production. Its activities are geographically diverse, spanning North America, various European nations, and Australia. Established in 1994, the company's corporate headquarters are situated in Calgary, Canada. The company holds extensive property interests across its operational regions. In Canada, it possesses an 81% working interest in 636,714 net developed acres and an 85% working interest in 301,026 net undeveloped acres. Its U.S. presence includes 130,715 net acres within the Powder River basin. European landholdings are significant: in France, covering the Aquitaine and Paris Basins, it maintains a 96% working interest in 248,873 net developed acres and an 86% working interest in 134,160 net undeveloped acres. The Netherlands contributes a 53% working interest across 901,791 net acres. In Germany, Vermilion manages 54,625 net developed acres alongside 920,723 net undeveloped acres. Further European land positions include 975,375 net acres in Croatia, 946,666 net acres in Hungary, and 48,954 net acres in Slovakia. Beyond these land-based assets, Vermilion also participates in significant offshore production. It holds a 20% interest in the Corrib natural gas field, located off Ireland's northwest coast. In Australia, the company has a 100% working interest in the 59,553-acre Wandoo offshore oil field and its associated production facilities, situated on the northwest shelf. As of December 31, 2021, Vermilion's active well count included: Canada: 401 net conventional natural gas wells and 2,132 net light and medium crude oil wells. United States: 167.6 net light and medium crude oil wells. France: 297.0 net light and medium crude oil wells and 3 net conventional natural gas wells. Netherlands: 47 net natural gas wells.
Otter Score Breakdown
How it's scoredFive components, each rated 1–5★ and equally weighted (20%), averaged to a 0–100 score:💎 Quality — gross margin🚀 Growth — revenue YoY⚖️ Valuation — P/S ratio⚡ Momentum — 30-day price change💧 Dilution — 1-yr share issuance (buybacks score higher)Analyst Ratings
ⓘLatest News & Updates
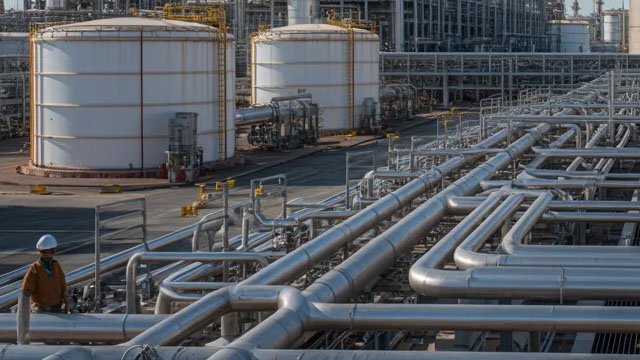
Vermilion Energy: The 2028 Cash Flow Inflection Is Still Deeply Mispriced
Vermilion Energy remains a Strong Buy, trading at a deep discount amid its ongoing portfolio transformation. VET is nearing a major cash flow inflection, with Montney and European projects ramping, targeting C$1.7B EFCF
Engineers Gate Manager LP Buys 117,219 Shares of Vermilion Energy Inc. $VET
Engineers Gate Manager LP raised its stake in Vermilion Energy Inc. (NYSE: VET) (TSE: VET) by 212.3% during the second quarter, according to its most recent Form 13F filing with the Securities and Exchange Commission (SE
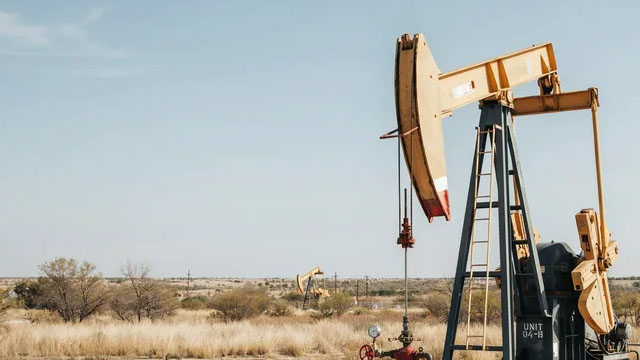
Vermilion Energy: Buy It Before The Hedges Expire
Vermilion Energy is rated a buy with roughly 25 to 30 percent probability-weighted upside. The market prices the stock as if its hedges never expire, but they roll off contractually. Hedged production falls from 47 perce

Vermilion Energy: Coming Off Strong After A Great Q2 Showing
Vermilion Energy Inc. delivered strong top and bottom-line results, surpassing consensus and significantly improving its financial profile through aggressive deleveraging. Vermilion Energy's global footprint enables expo
Vermilion Energy: Better Execution, Still Not Clean Enough
Vermilion Energy offers diversified production with premium European gas exposure, differentiating it from typical Canadian E&Ps. Q2 results exceeded production guidance without increasing capex, driving strong free cash

Vermilion Energy Q2 Earnings Call Highlights
Vermilion Energy NYSE: VET reported second-quarter production above the top end of its guidance range, increased its full-year output outlook without raising its capital budget, and expanded its shareholder-return target