
RELIANCE INC
RSNYSETrading Snapshot
- Day Range
- $384.61 – $392.35
- 52-Week Range
- $260.31 – $433.02
- Volume
- $2.81B
- Avg Volume
- $3.53B
- Shares Outstanding
- 51.1M
- Next Earnings
- Oct 17, 2026
Fundamentals Snapshot
- Annual Revenue
- $14.29B
- Last Q Revenue
- $4.63B
- P/E Ratio
- 22.4
- P/S Ratio
- 1.3x
- EPS (TTM)
- $17.44
- Dividend Yield
- 1.28%
- Dilution (1yr)
- −4.0%
Why Investors Own RS
- ✓High-growth profile — revenue up +4.6% YoY with expanding US Equity exposure.
- ✓Healthy economics — 43% gross margin and 10% free-cash-flow margin.
- ✓New products and segments could unlock additional revenue streams.
Execution delays, intensifying competition, and valuation compression if growth decelerates.
RELIANCE INC
RS StockOtter · stockotter.space
About RELIANCE INC
Reliance Steel & Aluminum Co. (RS) operates as a premier diversified metal solutions provider and a leading metal service center, serving clients across the United States, Canada, and globally. The company provides an extensive inventory of approximately 100,000 metal products, including alloys, aluminum, brass, copper, carbon steel, stainless steel, titanium, and various specialty steels. Beyond distribution, it offers comprehensive metal processing services to diverse sectors such as general manufacturing, non-residential construction, transportation, aerospace, energy, electronics and semiconductor fabrication, and heavy industries. Additionally, RS supplies non-ferrous metals and tubular building products, while also manufacturing bespoke extruded metals, fabricated components, and welded parts. As of December 31, 2021, its network comprised about 315 facilities spread across 40 U.S. states and 13 other countries. The company directly sells its offerings to original equipment manufacturers, largely catering to small machine shops and fabricators. Founded in 1939, Reliance Steel & Aluminum Co. is headquartered in Los Angeles, California.
Otter Score Breakdown
How it's scoredFive components, each rated 1–5★ and equally weighted (20%), averaged to a 0–100 score:💎 Quality — gross margin🚀 Growth — revenue YoY⚖️ Valuation — P/S ratio⚡ Momentum — 30-day price change💧 Dilution — 1-yr share issuance (buybacks score higher)Analyst Ratings
ⓘLatest News & Updates

Best Momentum Stocks to Buy for September 25th
BFH, SDRL and RS made it to the Zacks Rank #1 (Strong Buy) momentum stocks list on September 25th, 2026.
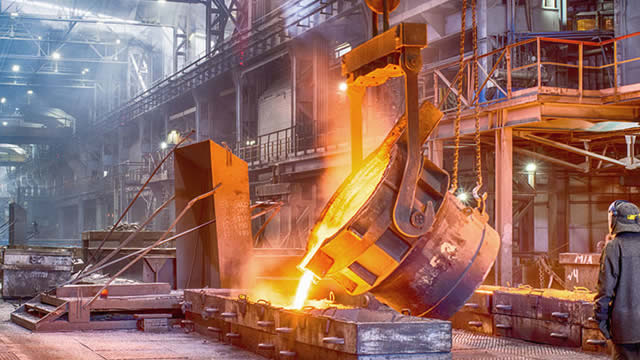
RS or WPM: Which Is the Better Value Stock Right Now?
Investors interested in Mining - Miscellaneous stocks are likely familiar with Reliance (RS) and Wheaton Precious Metals Corp. (WPM). But which of these two stocks is more attractive to value investors?

These 2 Basic Materials Stocks Could Beat Earnings: Why They Should Be on Your Radar
Finding stocks expected to beat quarterly earnings estimates becomes an easier task with our Zacks Earnings ESP.
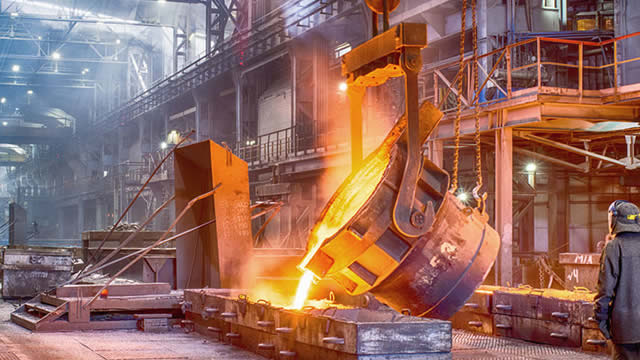
Are Basic Materials Stocks Lagging Reliance, Inc. (RS) This Year?
Here is how Reliance (RS) and Sensient Technologies (SXT) have performed compared to their sector so far this year.
Reliance, Inc. $RS Shares Purchased by NewEdge Advisors LLC
NewEdge Advisors LLC raised its position in Reliance, Inc. (NYSE: RS) by 189.2% during the second quarter, according to its most recent filing with the SEC. The institutional investor owned 6,423 shares of the industrial

Reliance Jumps 33% YTD: Here's What's Driving the Stock
RS' 33% YTD rally reflects strong construction demand, strategic acquisitions and robust shareholder returns through dividends and buybacks.