
ROYALTY MANAGEMENT HOLDING C
RMCONASDAQTrading Snapshot
- Day Range
- $2.48 – $2.53
- 52-Week Range
- $1.74 – $5.00
- Volume
- $1.58B
- Avg Volume
- $1.90B
- Shares Outstanding
- 15.1M
- Next Earnings
- Nov 20, 2026
Fundamentals Snapshot
- Annual Revenue
- $5M
- Last Q Revenue
- $2M
- P/E Ratio
- -42.7
- P/S Ratio
- 6.4x
- EPS (TTM)
- $-0.06
- Dividend Yield
- 0.38%
- Dilution (1yr)
- +0.1%
Why Investors Own RMCO
- ✓High-growth profile — revenue up +8.8% YoY with expanding US Equity exposure.
- ✓Healthy economics — 60% gross margin and 23% free-cash-flow margin.
- ✓New products and segments could unlock additional revenue streams.
Execution delays, intensifying competition, and valuation compression if growth decelerates.
ROYALTY MANAGEMENT HOLDING C
RMCO StockOtter · stockotter.space
About ROYALTY MANAGEMENT HOLDING C
Royalty Management Holding Corporation operates as a royalty enterprise, dedicated to identifying and capitalizing on undervalued opportunities. Its acquisition and investment activities span a broad spectrum, encompassing natural resources, patents, intellectual property, and various digital assets. Established in 2021, this Indiana-based company operates from Fishers.
Otter Score Breakdown
How it's scoredFive components, each rated 1–5★ and equally weighted (20%), averaged to a 0–100 score:💎 Quality — gross margin🚀 Growth — revenue YoY⚖️ Valuation — P/S ratio⚡ Momentum — 30-day price change💧 Dilution — 1-yr share issuance (buybacks score higher)Analyst Price Target
ⓘLatest News & Updates

AstraBit Adds Institutional Markets and Digital-Asset Leaders Lisa Wade and Josh Hawes to its Advisory Board
These appointments strengthen AstraBit's leadership and presence in digital-asset infrastructure, market structure, quantitative risk management, and critical minerals. These appointments strengthen AstraBit's leadership

Royalty Management Holding Corporation (NASDAQ:RMCO) to Issue Quarterly Dividend of $0.00
Royalty Management Holding Corporation (NASDAQ: RMCO - Get Free Report) announced a quarterly dividend on Thursday, July 16th. Shareholders of record on Wednesday, September 30th will be given a dividend of $0.0025 per s
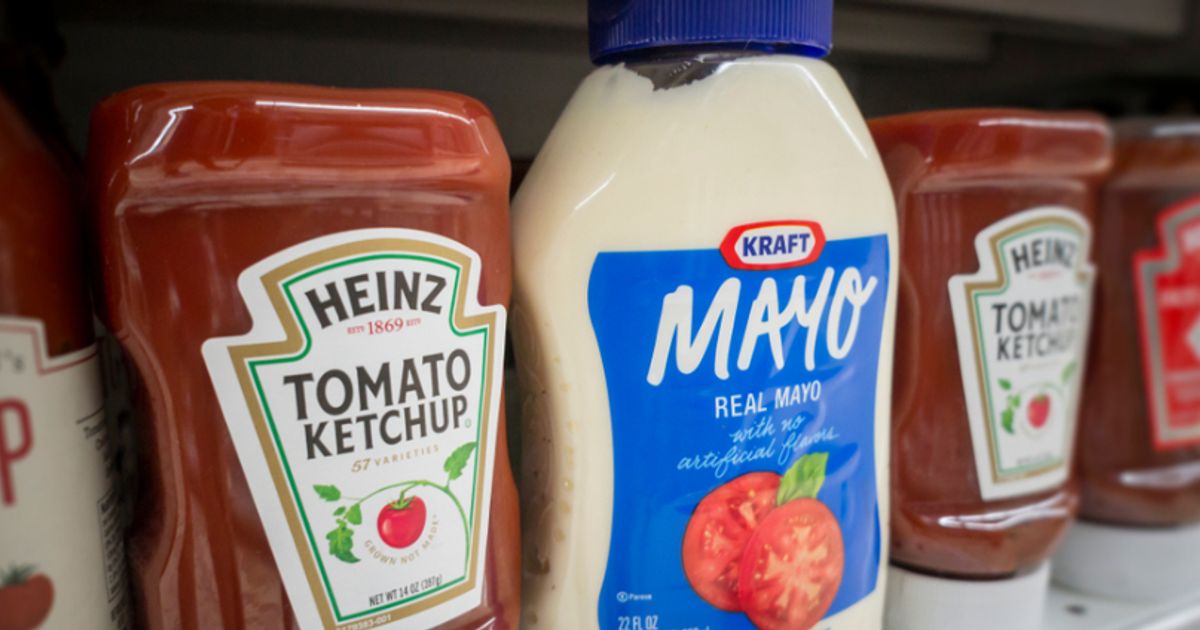
Kraft Heinz earnings in focus as investors look for signs of sustained demand improvement
Kraft Heinz Co (NASDAQ:KHC, XETRA:KHNZ) is scheduled to report second quarter earnings before the market opens on August 5, with investors expected to focus...

Royalty Management's ReElement holding secures $25M US defense investment
Royalty Management Holding Corp (NASDAQ:RMCO) said a company it holds a royalty stake in, ReElement Technologies, has closed new financing that will fund an expansion of operations and increase revenue flowing to Royalty