
KINDER MORGAN INC
KMINYSETrading Snapshot
- Day Range
- $30.00 – $30.89
- 52-Week Range
- $25.60 – $34.81
- Volume
- $4.62B
- Avg Volume
- $4.54B
- Shares Outstanding
- 2.23B
- Next Earnings
- Nov 29, 2026
Fundamentals Snapshot
- Annual Revenue
- $16.95B
- Last Q Revenue
- $4.48B
- P/E Ratio
- 19.6
- P/S Ratio
- 3.8x
- EPS (TTM)
- $1.56
- Dividend Yield
- 3.85%
- Dilution (1yr)
- +0.2%
Why Investors Own KMI
- ✓High-growth profile — revenue up +56.1% YoY with expanding US Equity exposure.
- ✓Healthy economics — 41% gross margin and 26% free-cash-flow margin.
- ✓New products and segments could unlock additional revenue streams.
Execution delays, intensifying competition, and valuation compression if growth decelerates.
KINDER MORGAN INC
KMI StockOtter · stockotter.space
About KINDER MORGAN INC
Kinder Morgan, Inc. operates as a leading energy infrastructure company across North America. Its extensive operations are categorized into four primary business segments: Natural Gas Pipelines, Products Pipelines, Terminals, and CO2. The Natural Gas Pipelines segment manages a vast network of interstate and intrastate natural gas pipelines, along with underground storage systems. This includes natural gas gathering systems, processing and treatment facilities, natural gas liquids fractionation plants, transportation systems, and infrastructure for liquefied natural gas liquefaction and storage. Within its Products Pipelines segment, the company owns and operates pipelines designed for refined petroleum products, crude oil, and condensate, supported by associated product terminals and facilities for petroleum pipeline transmix. The Terminals segment involves the ownership and operation of both liquid and bulk terminals that are utilized for storing and handling a wide array of commodities, such as gasoline, diesel fuel, various chemicals, ethanol, metals, and petroleum coke. This division also includes the ownership of tankers. Lastly, the CO2 segment is dedicated to the production, transportation, and marketing of carbon dioxide, primarily for enhanced oil recovery from mature oil fields. This segment also holds interests in or operates oil fields and gasoline processing plants, oversees a crude oil pipeline system located in West Texas, and manages renewable natural gas (RNG) and liquefied natural gas (LNG) facilities. In total, Kinder Morgan owns and operates approximately 83,000 miles of pipelines and 143 terminals. The company, initially named Kinder Morgan Holdco LLC, officially changed its name to Kinder Morgan, Inc. in February 2011. Founded in 1936, its corporate headquarters are situated in Houston, Texas.
Otter Score Breakdown
How it's scoredFive components, each rated 1–5★ and equally weighted (20%), averaged to a 0–100 score:💎 Quality — gross margin🚀 Growth — revenue YoY⚖️ Valuation — P/S ratio⚡ Momentum — 30-day price change💧 Dilution — 1-yr share issuance (buybacks score higher)Analyst Price Target
ⓘLatest News & Updates
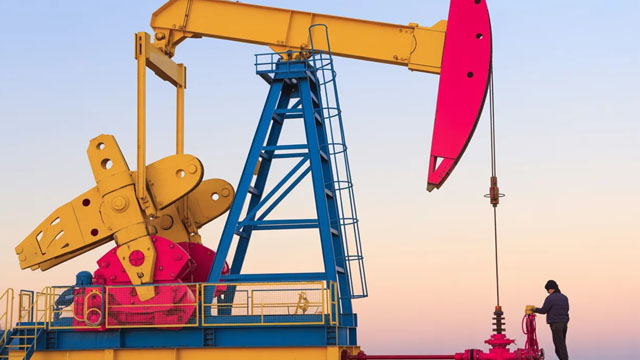
Kinder Morgan: Buy This 4% Yield With $10 Billion Growth Backlog
Kinder Morgan offers a compelling blend of income and growth, underpinned by fee-based cash flows and a $10.1 billion project backlog. KMI's natural gas focus, with volume growth and robust data center-driven demand, str
Analyzing Kinder Morgan (NYSE:KMI) and ENI (NYSE:E)
Kinder Morgan (NYSE: KMI - Get Free Report) and ENI (NYSE: E - Get Free Report) are both large-cap energy companies, but which is the superior business? We will contrast the two companies based on the strength of their r

Buy 5 Barron's Better Bets (Than T-Bills) Out Of 11 'Safer' September DiviDogs
Long-term bond yields persist despite pressure and circular remedies. But investors looking for income can still find plenty of attractive opportunities with dividend-paying stocks that have healthy yields. “23 stocks pa
Kinder Morgan (KMI) Stock Slides as Market Rises: Facts to Know Before You Trade
Kinder Morgan (KMI) reached $30.75 at the closing of the latest trading day, reflecting a -1.6% change compared to its last close.

ET vs. KMI: Which Energy Infrastructure Stock Offers More Potential?
Energy Transfer outpaces Kinder Morgan on earnings estimate revisions, ROE and valuation, while the latter carries less debt, sharpening the midstream stock comparison.
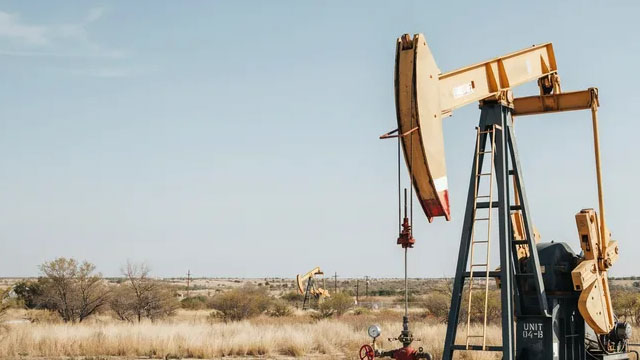
5 Midstream Giants That Raised Dividends Through Market Cycles: Your Guide to Recession-Resistant Income
Most investors assume energy dividends live and die with oil prices, but five pipeline operators have kept raising their payouts through every crash and recovery since 1999. The reason has everything to do with how midst