
ISHARES S&P GSCI COMMODITY I
GSGNYSE ARCATrading Snapshot
- Day Range
- $35.28 – $36.02
- 52-Week Range
- $22.37 – $37.30
- Volume
- $2.58B
- Avg Volume
- $2.26B
- Shares Outstanding
- 36.6M
- Next Earnings
- Nov 16, 2026
Fundamentals Snapshot
- Annual Revenue
- $43M
- Last Q Revenue
- $9M
- P/E Ratio
- 6.0
- P/S Ratio
- 33.1x
- EPS (TTM)
- $7.57
- Dividend Yield
- 0.00%
- Dilution (1yr)
- −14.9%
Why Investors Own GSG
- ✓High-growth profile — revenue up +15.5% YoY with expanding US Equity exposure.
- ✓Healthy economics — 62% gross margin and 21% free-cash-flow margin.
- ✓New products and segments could unlock additional revenue streams.
Execution delays, intensifying competition, and valuation compression if growth decelerates.
ISHARES S&P GSCI COMMODITY I
GSG StockOtter · stockotter.space
About ISHARES S&P GSCI COMMODITY I
The iShares S&P GSCI Commodity-Indexed Trust, referred to as "the Trust," aims to replicate the performance of a fully collateralized portfolio of futures contracts derived from a broad-based index of various commodities. It is important to note that this Trust is not registered as an investment company under the 1940 Investment Company Act, and as such, it does not adhere to the same regulatory standards as mutual funds or ETFs that are registered under that act. Investing in shares of the Trust is speculative and inherently carries a high degree of risk. Therefore, potential investors should thoroughly review the prospectus, especially the risk factors and all other pertinent information, before making any investment decision.
Otter Score Breakdown
How it's scoredFive components, each rated 1–5★ and equally weighted (20%), averaged to a 0–100 score:💎 Quality — gross margin🚀 Growth — revenue YoY⚖️ Valuation — P/S ratio⚡ Momentum — 30-day price change💧 Dilution — 1-yr share issuance (buybacks score higher)Analyst Price Target
ⓘLatest News & Updates
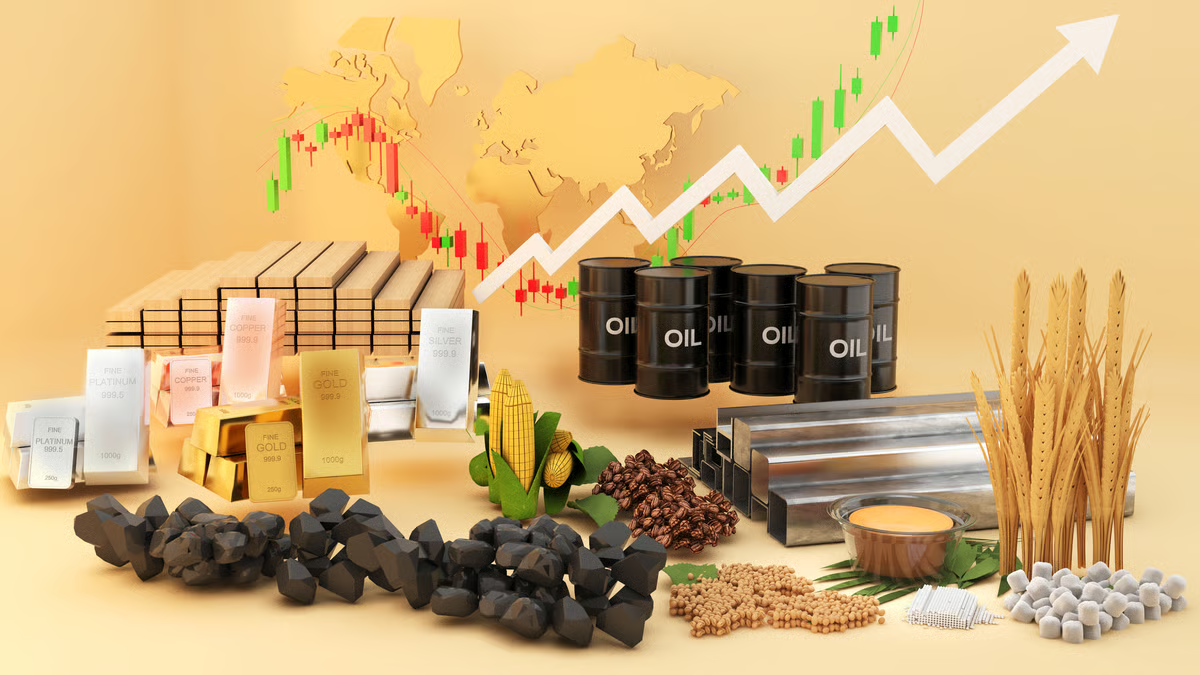
This Was the Best-Performing Asset Class in August
Commodities crushed all other asset classes last month, with gold and crude oil leading the way.

The Big 3: GSG, PHYS, GDX
Monday's Big 3 is focused on the commodity space, as Dan Russo turns to three products he sees holding potential in the coming weeks and months. He walks investors through his key takeaways on the iShares S&P GSCI Commod

The Prospects For The GSG ETF Are Tied To Energy
I downgrade iShares S&P GSCI Commodity-Indexed Trust ETF (GSG) from Buy to Hold as risks have increased and the price is now near $30.50. GSG's energy-centric exposure drove strong H1 2026 outperformance, but sector vola

The Big 3: SPX, AGG. GSG
Dan Russo takes us through today's Big 3 by highlighting trends in the S&P 500 (SPX) as the index trades just under its all-time high. He also highlights the iShares Core US Aggregate Bond ETF (AGG) and the iShares S&P G

Beyond Gold: Why Broad Commodities ETFs Win
Gold — the commodity most investors associate with the category — doesn't currently appear at all in one broad commodities fund's portfolio. Refined fuel contracts top the lineup instead.