
DIAMONDBACK ENERGY INC
FANGNASDAQTrading Snapshot
- Day Range
- $181.30 – $186.15
- 52-Week Range
- $137.03 – $216.90
- Volume
- $2.87B
- Avg Volume
- $2.99B
- Shares Outstanding
- 281.3M
- Next Earnings
- Nov 5, 2026
Fundamentals Snapshot
- Annual Revenue
- $15.03B
- Last Q Revenue
- $5.56B
- P/E Ratio
- 36.0
- P/S Ratio
- 3.0x
- EPS (TTM)
- $5.64
- Dividend Yield
- 2.31%
- Dilution (1yr)
- −2.2%
Why Investors Own FANG
- ✓High-growth profile — revenue up -5.2% YoY with expanding US Equity exposure.
- ✓Healthy economics — 65% gross margin and 7% free-cash-flow margin.
- ✓New products and segments could unlock additional revenue streams.
Execution delays, intensifying competition, and valuation compression if growth decelerates.
DIAMONDBACK ENERGY INC
FANG StockOtter · stockotter.space
About DIAMONDBACK ENERGY INC
Diamondback Energy, Inc. operates as an independent enterprise focused on oil and natural gas. Its core business involves the acquisition, development, exploration, and production of unconventional and onshore hydrocarbon reserves, predominantly located within the Permian Basin across West Texas and New Mexico. The company's development efforts primarily target significant geological formations, including the Spraberry and Wolfcamp in the Midland Basin, as well as the Wolfcamp and Bone Spring within the Delaware Basin – both crucial components of the broader Permian. As of December 31, 2021, Diamondback Energy's asset base included approximately 524,700 gross acres under its control in the Permian Basin. At that time, its estimated proved oil and natural gas reserves amounted to 1,788,991 thousand barrels of crude oil equivalent. The company also maintained working interests in 5,289 gross producing wells and held royalty interests in an additional 6,455 wells. Beyond its direct well operations, Diamondback Energy possesses mineral interests spanning roughly 930,871 gross acres and 27,027 net royalty acres across the Permian Basin and the Eagle Ford Shale. Furthermore, it manages a portfolio of midstream infrastructure, owning, operating, developing, and acquiring assets such as 866 miles of crude oil gathering pipelines, natural gas gathering pipelines, and an integrated water system within the Midland and Delaware Basins of the Permian. Established in 2007, Diamondback Energy, Inc. is headquartered in Midland, Texas.
Otter Score Breakdown
How it's scoredFive components, each rated 1–5★ and equally weighted (20%), averaged to a 0–100 score:💎 Quality — gross margin🚀 Growth — revenue YoY⚖️ Valuation — P/S ratio⚡ Momentum — 30-day price change💧 Dilution — 1-yr share issuance (buybacks score higher)Analyst Price Target
ⓘLatest News & Updates
Oil May Be Stronger Than It Looks—And Diamondback Is on Sale
Oil prices slipped back below $100 this week, and Diamondback Energy NASDAQ: FANG shareholders felt every bit of it. The Permian Basin producer now trades about 11% below its September high.
Diamondback Energy (FANG) Stock Drops Despite Market Gains: Important Facts to Note
Diamondback Energy (FANG) reached $189.27 at the closing of the latest trading day, reflecting a -1.64% change compared to its last close.

This Overlooked Pipeline Stock Just Became a Rival's Joint-Venture Partner Without Anyone Noticing
MPLX LP didn't just team up with a pipeline rival; it also teamed up with two rivals in the upstream sector, too.
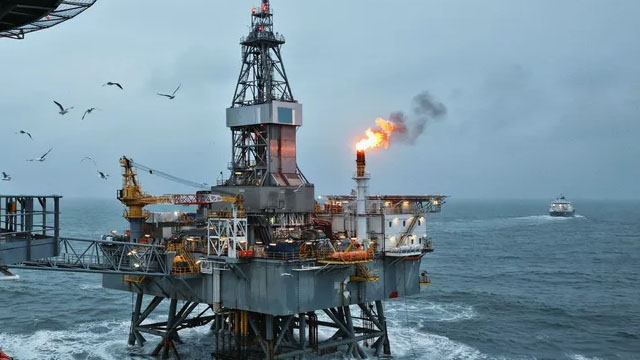
This Diamondback Insider Is One of the World's Richest People. She Just Sold $2 Billion of Stock.
SGF Fang Holdings, an investment vehicle for billionaire Lyndal Stephens Greth, sold more than 9 million Diamondback Energy shares.

First Look: Buffett Steps Down, Fed Hikes, Paramount-WBD Merger
Prefer to listen? Hear this as a ~5-minute audio briefing on The GuruFocus Brief.Stock NewsBuffett to exit Berkshire chair role: Warren Buffett (Trades, Portfol
Diamondback Energy, Inc. $FANG Shares Purchased by Bank of America Corp DE
Bank of America Corp DE boosted its holdings in Diamondback Energy, Inc. (NASDAQ: FANG) by 8.9% during the undefined quarter, according to its most recent disclosure with the SEC. The firm owned 1,489,391 shares of the o