
AMAZON.COM INC
AMZNNASDAQTrading Snapshot
- Day Range
- $245.39 – $259.97
- 52-Week Range
- $196.00 – $287.20
- Volume (shares)
- 74,362,636
- Avg Volume (shares)
- —
- Shares Outstanding
- 10.81B
- Next Earnings
- 2027-02-03
Fundamentals Snapshot
- Annual Revenue
- $716.92B
- Last Q Revenue
- $201.94B
- P/E Ratio
- 20.6
- P/S Ratio
- 3.5x
- EPS (TTM)
- $12.37
- Dividend Yield
- —
- Dilution (1yr)
- +0.9%
AMAZON.COM INC
AMZN StockOtter · stockotter.space
About AMAZON.COM INC
E-commerce and cloud (AWS).
Otter Score Breakdown
How it's scoredFive components, each rated 1–5★ and equally weighted (20%), averaged to a 0–100 score:💎 Quality — gross margin🚀 Growth — revenue YoY⚖️ Valuation — P/S ratio⚡ Momentum — 30-day price change💧 Dilution — 1-yr share issuance (buybacks score higher)Latest News & Updates

Amazon.com vs. Home Depot: Which Consumer Stock Is a Better Buy for 2027?
Amazon.com maintains a dominant lead in cloud infrastructure and high-growth digital advertising services. Home Depot focuses on expanding its share of the professional contractor market through strategic acquisitions.

ULA Vulcan Launch Ends in Disaster for Amazon's Satellite Internet Ambitions
A United Launch Alliance Vulcan Centaur rocket failed to reach orbit in its first attempt in nine months. The rocket was carrying 40 Amazon Leo internet satellites -- all now lost.
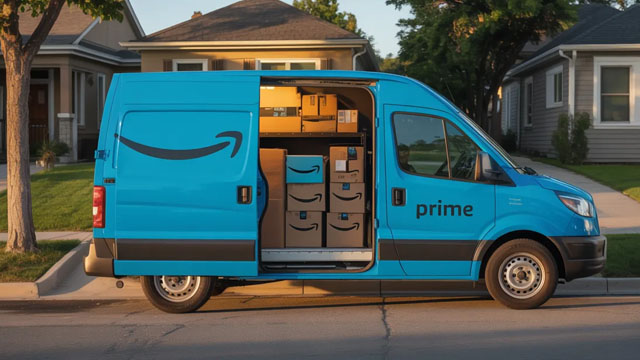
The Ultimate Growth Stock to Buy With $1,000 Before the End of November
Amazon is trading near its lowest valuation in more than a decade. Last quarter, Amazon saw its fastest AWS growth in almost five years.

2 Growth Stocks That Could Double by 2031
All it takes is a 15% annualized gain to double a stock's value in five years. Amazon's expanding margins, led by advertising, may not be fully priced in by the market.

How Amazon's products and strategy have evolved under Panos Panay
We noticed that Amazon's product lineup this year is less, shall we say, cheap. Not only are component costs contributing to the the overall increase in prices across the tech industry, but Panos Panay explains how other
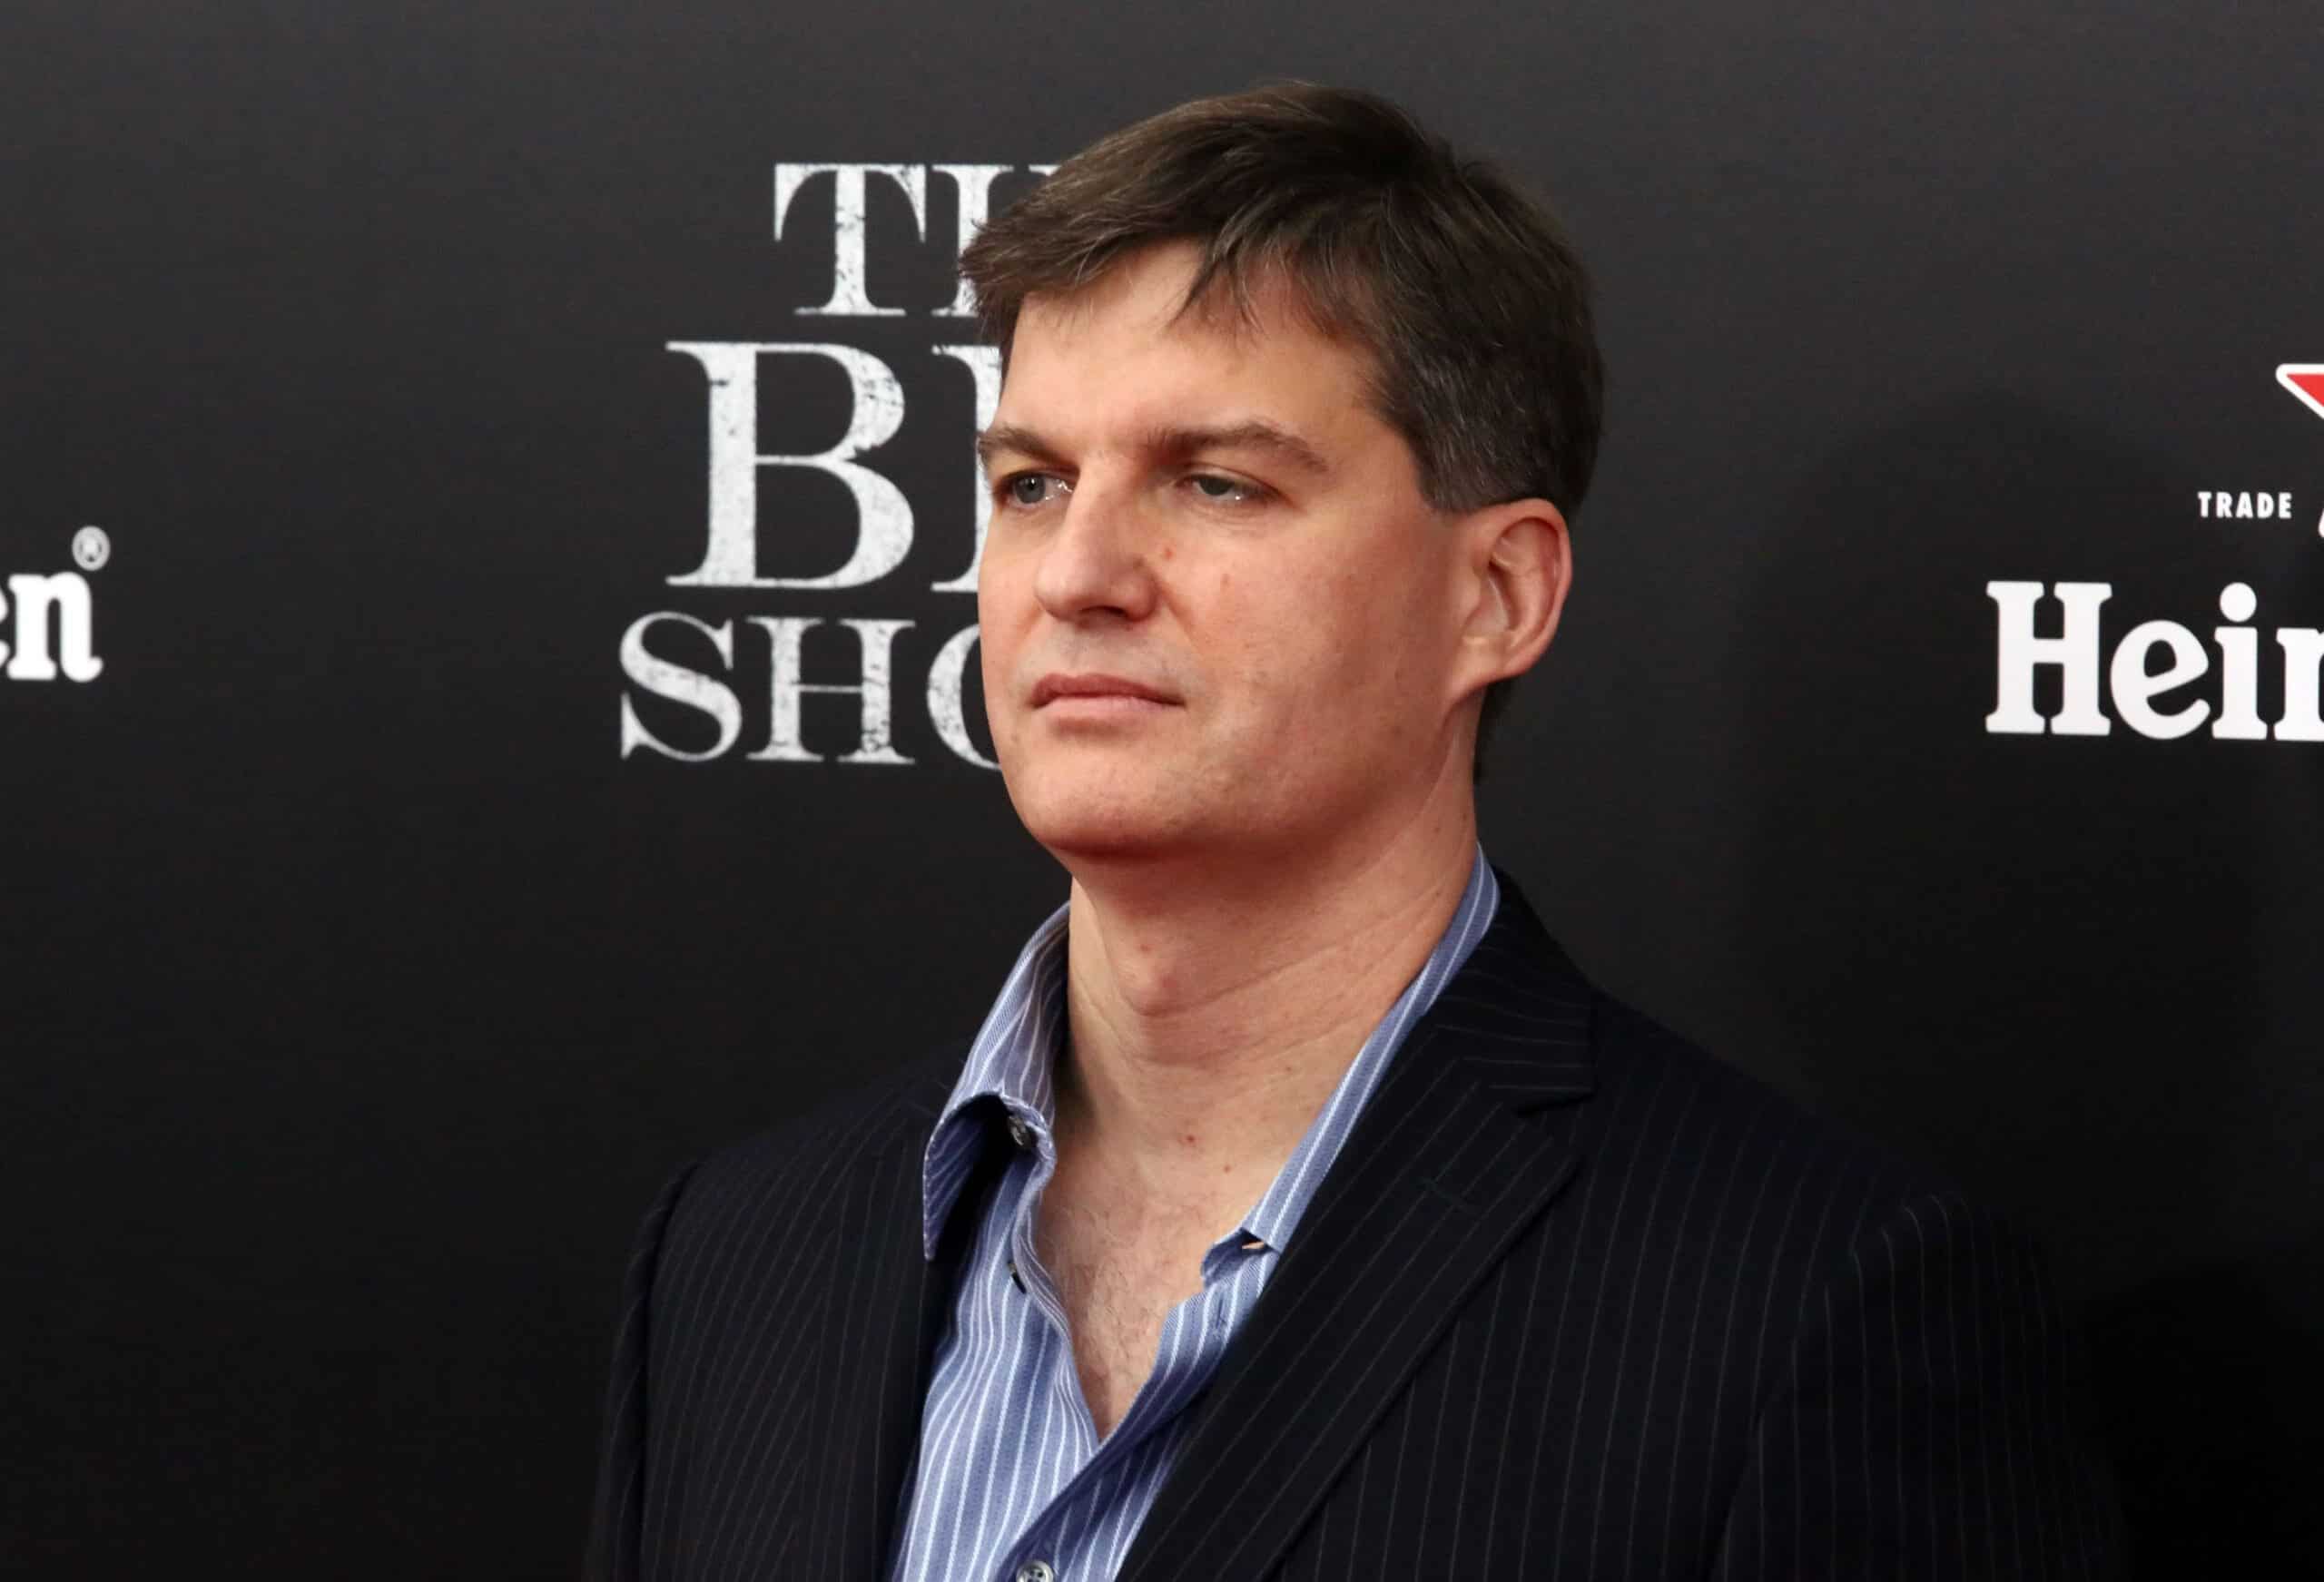
Michael Burry Says ‘I Told You So’ as Wall Street Caught Off Guard by AI Selloff
Nvidia, CoreWeave, and Nebius are sliding while Michael Burry takes a victory lap. But a closer look at Microsoft and Amazon shows the AI boom's real fault line may run somewhere few investors are watching.